
By Allen Shaw, Ph.D.
Chief Economist for Global Economic Consulting Associates, Inc. and CEIR Economist
27 March, 2020
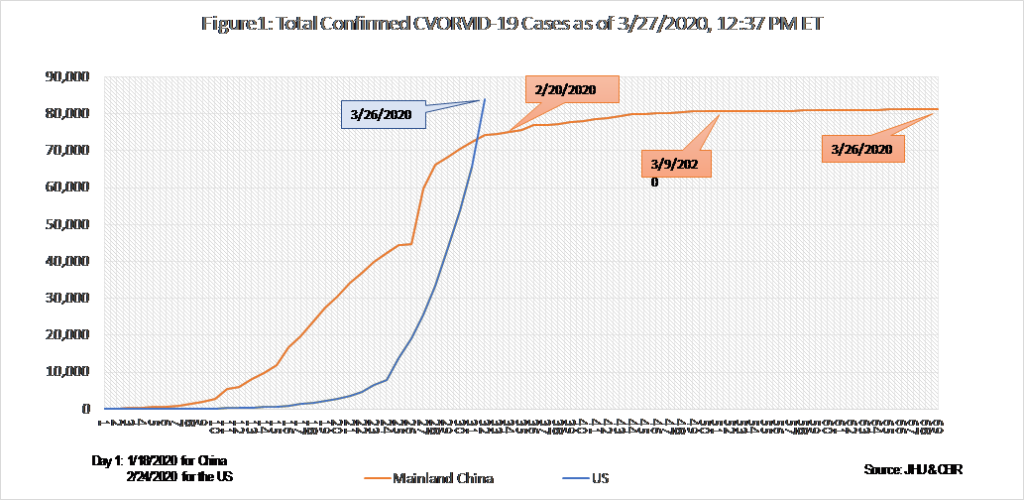
On 8 December, 2019 China reported the first patient who developed symptoms of COVID-19 in Wuhan, the capital of Hubei province. Wuhan has a population of over 11 million people and is the seventh largest city in China. By 20 January 2020, the outbreak had spread to two other key cities: Shenzhen and Beijing. Significant confirmed cases started from 18 January, 2020 with 53 cases in Mainland China (China excluding Hong Kong and Macau). There was a spike on 13 February when confirmed cases by CT scans was added to the total confirmed cases by PCR tests, which are considered more accurate tests. According to Johns Hopkins University’s (JHU) COVID-19 data, total confirmed cases reached a plateau of just slightly under 81,000 on 9 March, 2020; 50 days after significant cases were reported on 18 January (see Figures 1 & 2).
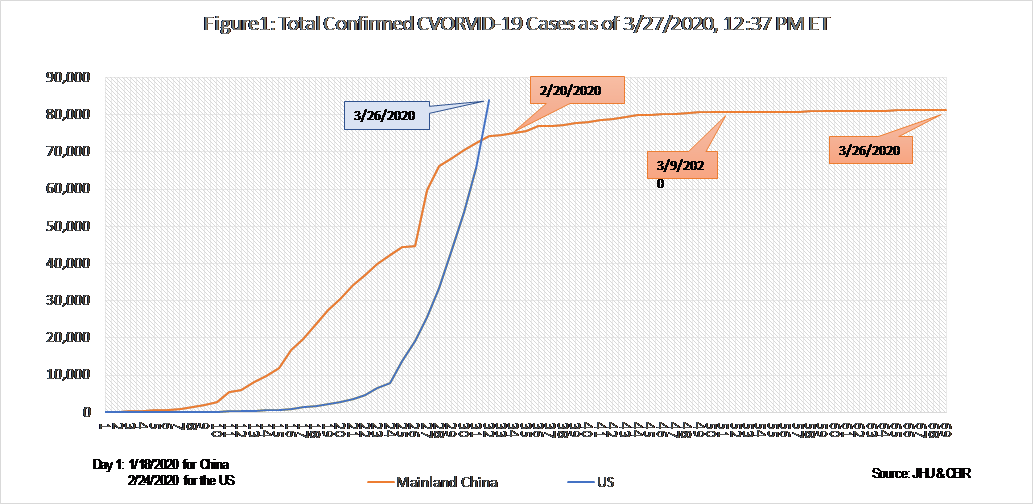
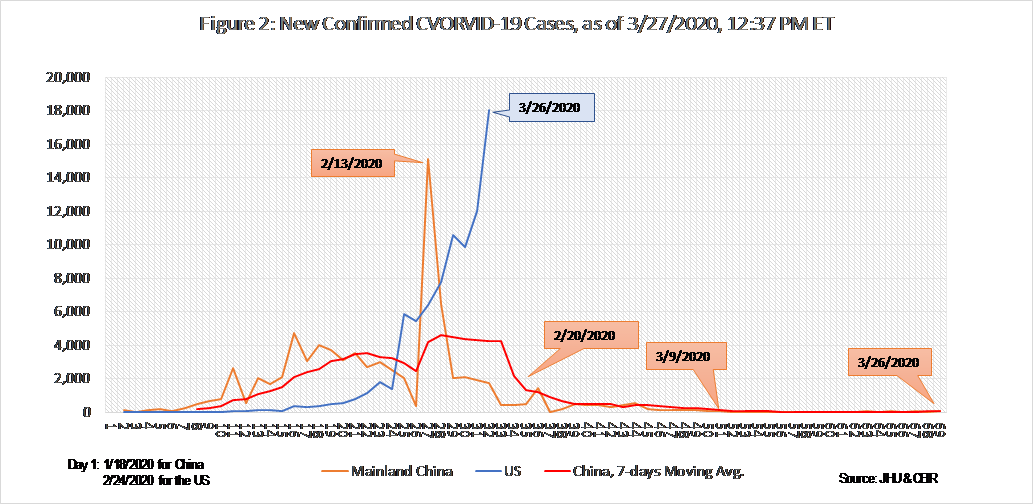
On 30 January 2020 the first case of person-to-person transmission of COVID-19 was reported in the US. Significant increases of new confirmed cases in the US started from 24 February with 51 total confirmed cases. As shown in Figure 3, new confirmed cases were still relatively small during the period from Day 1 (24 February) through Day 15 (9 March, 2020) primarily due to shortage of test kits rather than a lower rate of infection. The availability of test kits and testing places has improved since 9 March. On 26 March the US overtook Mainland China in total confirmed cases; 83,836 in the US, compared to 81,298 in Mainland China. Adjusted for the difference in the size of population, total confirmed cases per million of persons in the US have surpassed China on 19 March 2020 (see Figure 3). On 26 March 2020, total confirmed cases per million of persons stood at 251 in the US, compared to 58 in China.
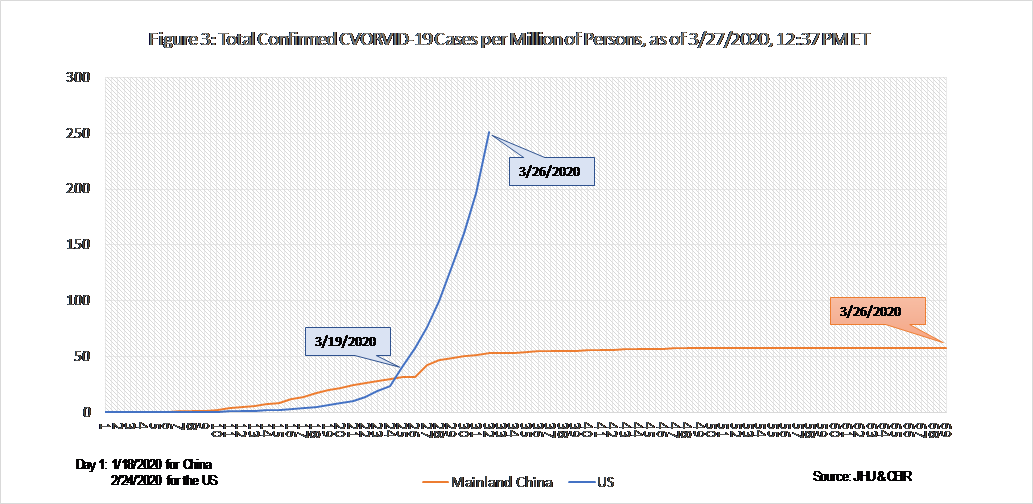
In China, because of drastic isolation policies, the number of new cases starts to slowdown from 20 February (Day 34) and the total number of confirmed cases begins to stabilize from 9 March (Day 51). Using China as a guide, and other things being equal, US should reach a plateau around 14 April (51 days from 24 February). However, the quarantine of infected persons without severe symptoms, social distancing and lockdown measures in the US have not been as extensive and strict as in China. Total confirmed cases will not reach a plateau until late April at the earliest. For that to happen, new confirmed cases will have to start declining no later than mid-April. We will continue to watch the blue line in Figures 2 and 3.

